What Business Analytics Tools Should You Actually Learn First?
If you are trying to break into business analytics, your LinkedIn feed is probably giving you major anxiety. Every "influencer" has a different roadmap. One person says you're useless without Python. Another says Power BI is dead and you need to learn some obscure new software.
Let’s cut through the noise. You do not need to learn ten different tools to get an entry-level job. In fact, if you try to learn everything at once, you will end up confused, burnt out, and mediocre at all of them.
At Learnhub Education, we see students fall into the "tool trap" every single semester. They think hiring managers care about how many software logos they can paste onto their resume. They don't. Managers care if you can look at a messy pile of numbers and find a way to save the company money.
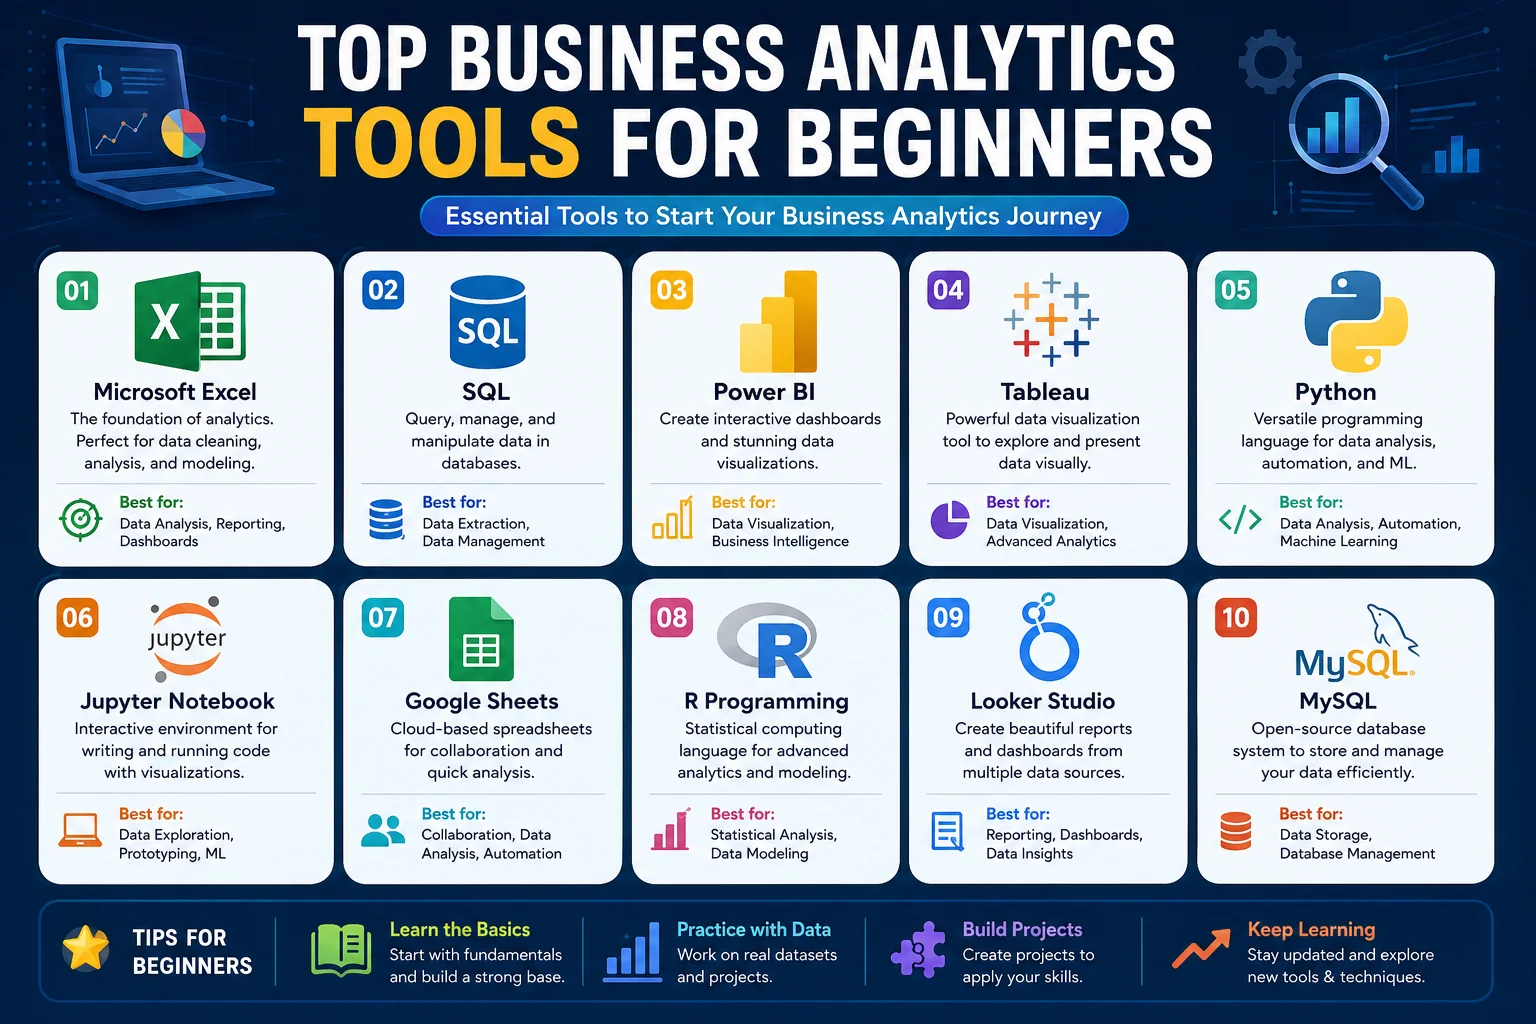
If you want a realistic, fluff-free roadmap, here are the only tools you actually need to care about right now.
1. Microsoft Excel (The One You Can't Escape)
Everyone wants to skip Excel because it doesn't sound sexy. It feels like old software your parents used in the 90s.
But here is a reality check: Excel runs the world. Small startups use it. Fortune 500 CEOs use it. Even teams with multi-million dollar tech setups still download data into Excel to do quick checks. If you can’t navigate a spreadsheet, you cannot work in business analytics. Period.
Why it actually matters:
When you are new, you need to see your data. Coding languages like SQL or Python hide the data behind text. Excel puts it right in front of your face. You can touch the rows, color-code the columns, and see exactly how a formula changes a specific number. It builds your data intuition.
What to actually learn:
Forget about the advanced, obscure math formulas. Master these instead:
XLOOKUP (The modern version of VLOOKUP. Learn it, love it.)
Pivot Tables (This is 80% of the job. It turns 50,000 rows of chaotic sales data into a neat summary table in literally three clicks.)
IF Statements (Basic logic that helps you categorize data.)
2. SQL (The Gatekeeper)
Once you get comfortable with Excel, you hit a wall. Excel starts lagging and crashing if you throw too much data at it. If you work at a company like Spotify, Uber, or Walmart, their data is way too massive for a spreadsheet. It lives in giant databases.
SQL (Structured Query Language) is how you talk to those databases. Think of it like a search engine for a company’s private data vault.
Why it actually matters:
You can't analyze data if you can't get to it. In a real job, nobody is going to hand you a clean Excel file on a silver platter. You have to go find it yourself. SQL is almost always the highest-priority skill on entry-level job postings because it proves you can operate independently without bothering the engineering team.
What to actually learn:
The good news? SQL reads a lot like broken English. It’s very logical. Focus heavily on:
SELECT and WHERE (How to grab specific data and filter out the junk).
GROUP BY (How to count or average things by category).
JOINS (How to stitch two different tables together. This is usually the hardest part for beginners, so give yourself a week just to practice this).
3. Power BI or Tableau (The Storytellers)
Let’s say you used SQL to get the data, and you used Excel to double-check the math. Now you have to show your findings to your boss, or a client, or the VP of Marketing.
If you show them a giant table of numbers, their eyes will glaze over in five seconds. Executives are busy, and they want answers fast. That’s why we use data visualization tools like Tableau or Power BI. They turn raw numbers into interactive, easy-to-read charts and dashboards.
Power BI vs. Tableau: Which one?
Don't waste weeks agonizing over this choice. They do the exact same thing, just with different buttons.
Pick Power BI if you use a Windows computer and love the Microsoft ecosystem. It feels like an extension of Excel.
Pick Tableau if you want to focus heavily on design and creative visuals, or if you use a Mac (Power BI doesn't run natively on Mac without a workaround).
What to actually learn:
Don't just make a chart because it looks pretty. Learn data storytelling. If sales are dropping, don't just show a confusing pie chart with twenty colors. Use a clean line chart, highlight the drop in red, and add a simple text box explaining why it happened.
The Step-by-Step Learning Order
At Learnhub Education, we tell students to think of these tools like building a house. You don't put the roof on before you pour the concrete. Here is how you should pace yourself over three months:
Month 1: Focus entirely on Excel. Your main goal here is learning how data behaves, finding patterns, and getting comfortable doing basic math on large spreadsheets.
Month 2: Move on to SQL. Now that you know what clean data looks like, spend this month learning how to pull huge, raw chunks of it out of databases using queries.
Month 3: Cap it off with Power BI or Tableau. Finish your roadmap by learning how to take those SQL results and present them visually so non-technical people can easily understand them.
A Final Reality Check
You do not need a PhD, and you do not need to learn Python or machine learning to get your foot in the door.
The software is just a tool. A carpenter isn't amazing just because they own an expensive hammer; they are amazing because they know how to build a sturdy table. Pick one tool today—even if it's just opening Excel and messing around with a free dataset from Kaggle—and start building something. The curiosity to solve problems is worth way more than any software certification.
Frequently Asked Questions (The Honest Truth)
1. Can I get a business analyst job if I only know Excel?
Honestly? It’s tough nowadays. You might find a localized role at a smaller, traditional company, but most modern businesses expect you to at least know basic SQL too. Excel gets your foot in the door, but SQL locks it in.
2. Do I need to learn Python or R as a beginner?
No. Stop listening to people on tech Twitter. Python is fantastic for data science and heavy automation, but 90% of entry-level business analytics roles don't require it at all. Master Excel and SQL first.
3. Is Power BI better than Tableau?
Neither is objectively "better." Power BI is cheaper and dominates companies that run on Microsoft. Tableau is more artistic and loved by design-heavy tech firms. Pick one, learn the core concepts, and don't look back.
4. How long does it take to learn these tools?
If you study consistently for an hour a day, you can get highly proficient in Excel, basic SQL, and a viz tool (like Power BI) in about 3 to 4 months. Anyone claiming you can do it in a weekend is selling you a scam course.
5. Are certificates worth it for getting a job?
The piece of paper itself? No. A hiring manager won't hire you just because you have a certificate. What matters is the portfolio you built while getting that certificate. Show them real dashboards you made, not just a badge.
6. Where can I find free data to practice on?
Go to Kaggle or Google Dataset Search. You can download real, anonymous data on everything from Netflix viewing habits to local restaurant sales. Download a file and start messing around with it in Excel.
7. Do I need a tech degree to break into this field?
No. We see people transition into business analytics from marketing, nursing, teaching, and hospitality. Businesses care about your logical thinking and your ability to solve problems, not what your major was five years ago.
8. Is AI going to replace business analysts?
AI is good at writing basic code and generating charts, but it doesn't understand context. An AI doesn't know why your company's supply chain broke down in Ohio last week. It can help you clean data faster, but it won't replace human decision-making.
9. What is the hardest part about learning SQL?
Without a doubt, it’s JOINS and subqueries. Beginners always get confused when trying to link three different tables together in their head. Expect to get frustrated here—it’s completely normal. Just keep sketching tables out on paper.
10. Should I learn Google Sheets instead of Excel?
Learn Excel first. Google Sheets is great for quick collaboration, but Excel handles massive datasets much better and is still the undisputed gold standard in corporate offices. If you know Excel, switching to Google Sheets takes five minutes anyway.
11. What do companies mean by "Data Cleaning"?
Real-world data is incredibly messy. People type their names wrong, leave blank spaces, or put dates in five different formats. Data cleaning is the tedious process of fixing those errors before you run your analysis so your math isn't ruined.


